Description
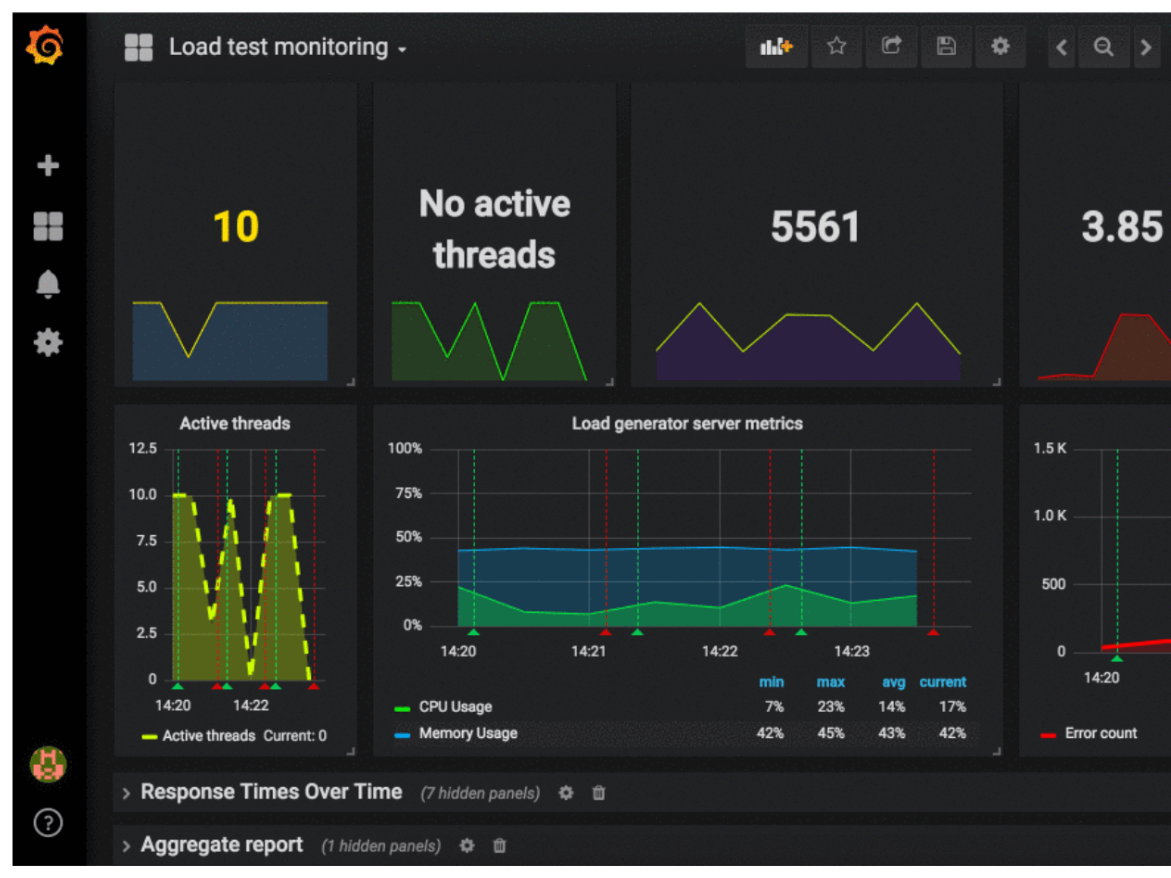
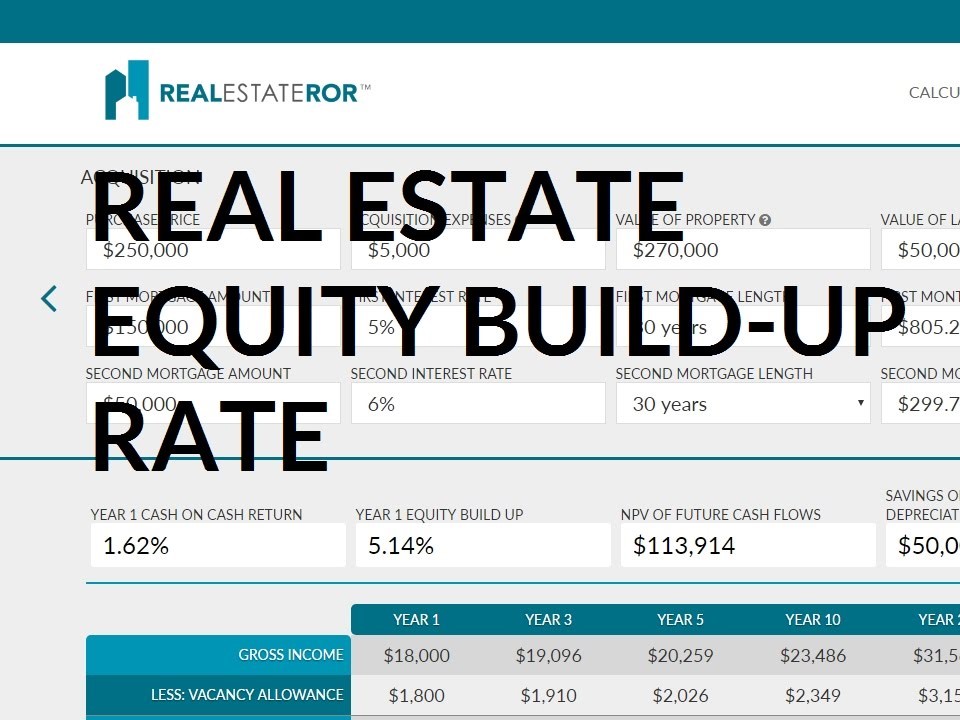
The Real-Time Market Trend Dashboard is an advanced analytics interface that provides a continuously updated view of residential and commercial property markets. Powered by big data and machine learning, the dashboard aggregates inputs from multiple real estate databases, listing platforms, public records, buyer activity, and economic indicators to deliver a comprehensive overview of market health. Users can visualize trends such as average price per square foot, listing volume, absorption rate, days on market, and neighborhood-specific appreciation metrics. Filters allow segmentation by city, zip code, property type, or price range, enabling agents, investors, and developers to tailor insights to their strategic needs. The dashboard also includes trend forecasting tools that use historical data patterns to project short- and mid-term market movements. Interactive graphs, heatmaps, and market sentiment indicators make it easy to identify emerging opportunities or risky zones. Additional layers show school ratings, crime stats, local amenities, and transportation access—providing a 360° view of market potential. With alert systems for unusual activity and competitive benchmarking tools, the Real-Time Market Trend Dashboard is indispensable for professionals aiming to make smart, timely, and well-informed property decisions.

Bitrus –
“I’ve been using this dashboard for several months now and it’s completely transformed how I approach my real estate investments. The up-to-date market data is incredibly insightful and easy to understand, allowing me to make informed decisions quickly. It saves me countless hours of research and helps me stay ahead of the curve in this competitive market. I highly recommend it to any serious real estate investor or agent.”
Oluwatoyin –
“I’ve found this tool incredibly helpful in understanding the current real estate market. The visual representation of data makes it easy to quickly identify trends and make informed decisions. It has saved me a lot of time and effort in my property search, and I feel much more confident about the market situation now.”
Abibat –
“I’ve found this tool incredibly helpful for staying on top of the latest real estate market changes. It’s user-friendly, provides clear and concise data visualizations, and has significantly improved my ability to make informed decisions for my clients. I highly recommend it to any real estate professional looking for an edge in today’s competitive market.”
Clement –
“I’ve been using this dashboard for a few months now, and it’s become an indispensable part of my real estate strategy. The data is incredibly accurate and up-to-date, allowing me to quickly identify emerging trends and make informed decisions. The interface is also very intuitive and easy to navigate, which saves me a lot of time and effort. I highly recommend it to anyone looking for a comprehensive and reliable market analysis tool.”
Nkechi –
“This dashboard has been invaluable in helping me stay ahead of the curve. The real-time data is accurate and presented in a way that’s easy to understand, allowing me to make informed decisions quickly. I highly recommend it to anyone looking to gain a competitive edge in the real estate market.”